Live Site
Overview
If you’re planning to build a virtual tour, this tutorial and code example aren’t intended for production use. Instead, consider using the free Marzipano Tool, which, while closed-source, offers an excellent starting point for creating virtual tours.
This project is valuable for anyone looking to learn more about how to build virtual tour, monitoring or analysis software using Marzipano as the 360° image viewer. In 2025, we anticipate that companies will likely group and link multiple RICOH THETA images together. This grouping will likely expand beyond traditional tours for entertainment or real estate sales and include activities such as monitoring an industrial process or the condition of public utility infrastructure.
Tour Types
There three types of virtual tours in wide use.
thumbnail
floor plan
In the floorplan tour, the audience clicks on a graphic that
represents the space.
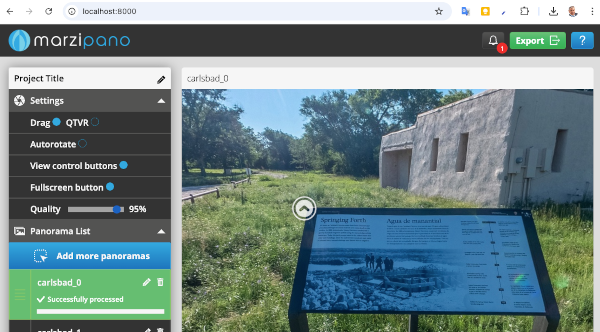
embedded arrow (this project)
This is the Google Street View or Google Maps style of
navigation between images.
The arrow can be any type of image. For example, it can be door.
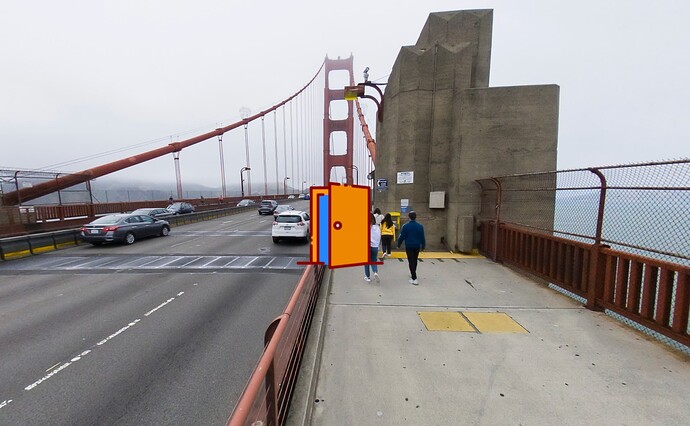
The arrow can also be made to clearly look like a button.

Intended Use Cases
This assessment is aimed at developers considering building custom software to manage 360° images for various applications, such as:
- factory floor monitoring and optimization
- retail space optimization
- real estate sales
- virtual experiences for parks, museums, hotels
- natural disaster assessment
- public infrastructure assessment - sewer pipes, rain water drainage, power lines
Learning Objectives
Most virtual tour software have common technology concepts.
- pitch and yaw of sphere and hotspots
- data format of tour
- performance - cubemap versus equirectangular, multi-resolution, compression
- editing
The best way to learn about these concepts is to build your own simplified virtual tour system.
Input Data
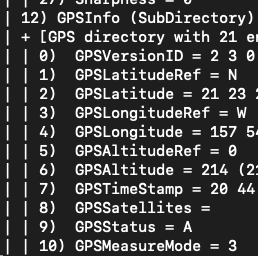
The project assumes images are captured with a RICOH THETA X or Z1 camera. This prototype demonstrates manual placement of hotspots. Future iterations will explore leveraging the built-in compass, gyroscope, and accelerometer metadata from these cameras. Additionally, the THETA X offers GNSS support for geolocation data.
For this study, the images lack metadata, focusing instead on:
- Hotspot events and data formats
- Basic Marzipano concepts, such as geometry, limits, views, and scenes
- User interaction for determining pitch and yaw values to build a tour
Although Marzipano is primarily a 360° image viewer, its combination with the Marzipano Tool provides a useful reference for building custom virtual tour software.
Data Format
There is no standardized format for representing virtual tour data, such as scenes, pitch, yaw, hotspots, and settings. While the Marzipano Tool’s data format can serve as a de facto standard, this project uses a simplified custom format to make getting started easier. For instance, each scene uses a unique ID based on the image filename.
Example data:
const data = [
  {
    filename: "carlsbad_0.jpg",
    yaw: 0.009621012850468347,
    pitch: 0.5,
    hotspots: [
      {
        yaw: -0.8043556272753545,
        pitch: -0.10639414611516074,
        switchTo: 1,
        icon: "up.png",
      },
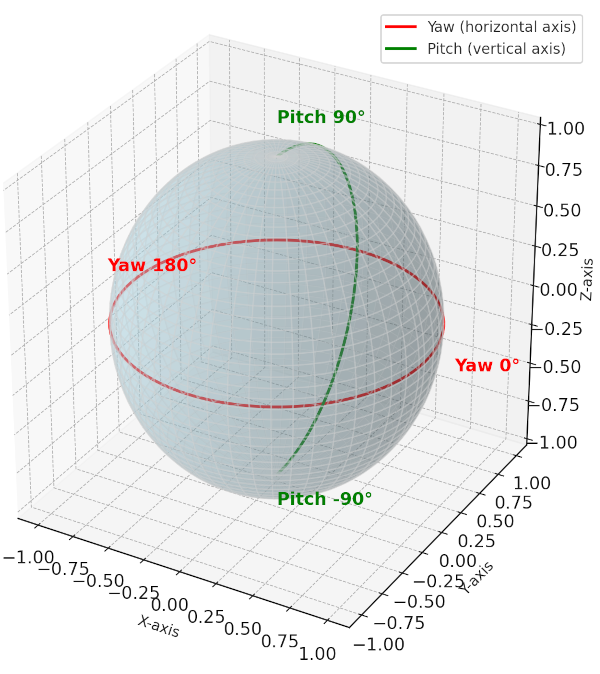
Pitch and Yaw
Pitch refers to vertical movement (up and down), while yaw indicates horizontal movement (left and right). These values are expressed in radians:
- A full circle equals 2 * pi radians (360°).
- Half a circle equals 1 * pi radians (180°).
Determining Pitch and Yaw
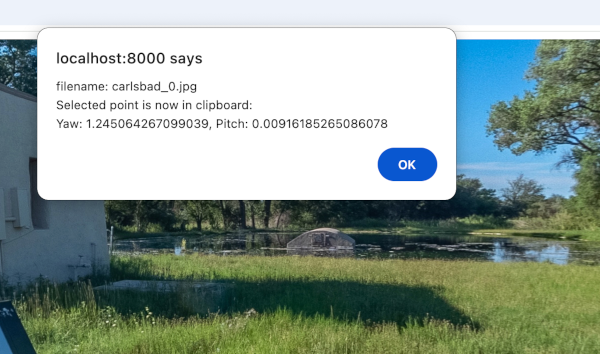
As an educational project, pitch and yaw values are determined manually by clicking on a scene in the viewer. This interaction calculates the pitch and yaw values.
A simple tool has been added to save these values to the clipboard, which can then be pasted into data.json. This tool appears after a mouse press lasting longer than 3.1 seconds.
Relevant code snippet:
// Convert to normalized coordinates (0 to 1)

var x = relativeX / rect.width;

var y = relativeY / rect.height;

// Use method from Marzipano View: screenToCoordinates

var result = currentView.screenToCoordinates({ x: relativeX, y: relativeY });
Result example:
Yaw: ${result.yaw}, Pitch: ${result.pitch}`
For initial view, placing mouse in center of screen gives the center of the view.
For the hotspot, the mouse is in the upper right corner.
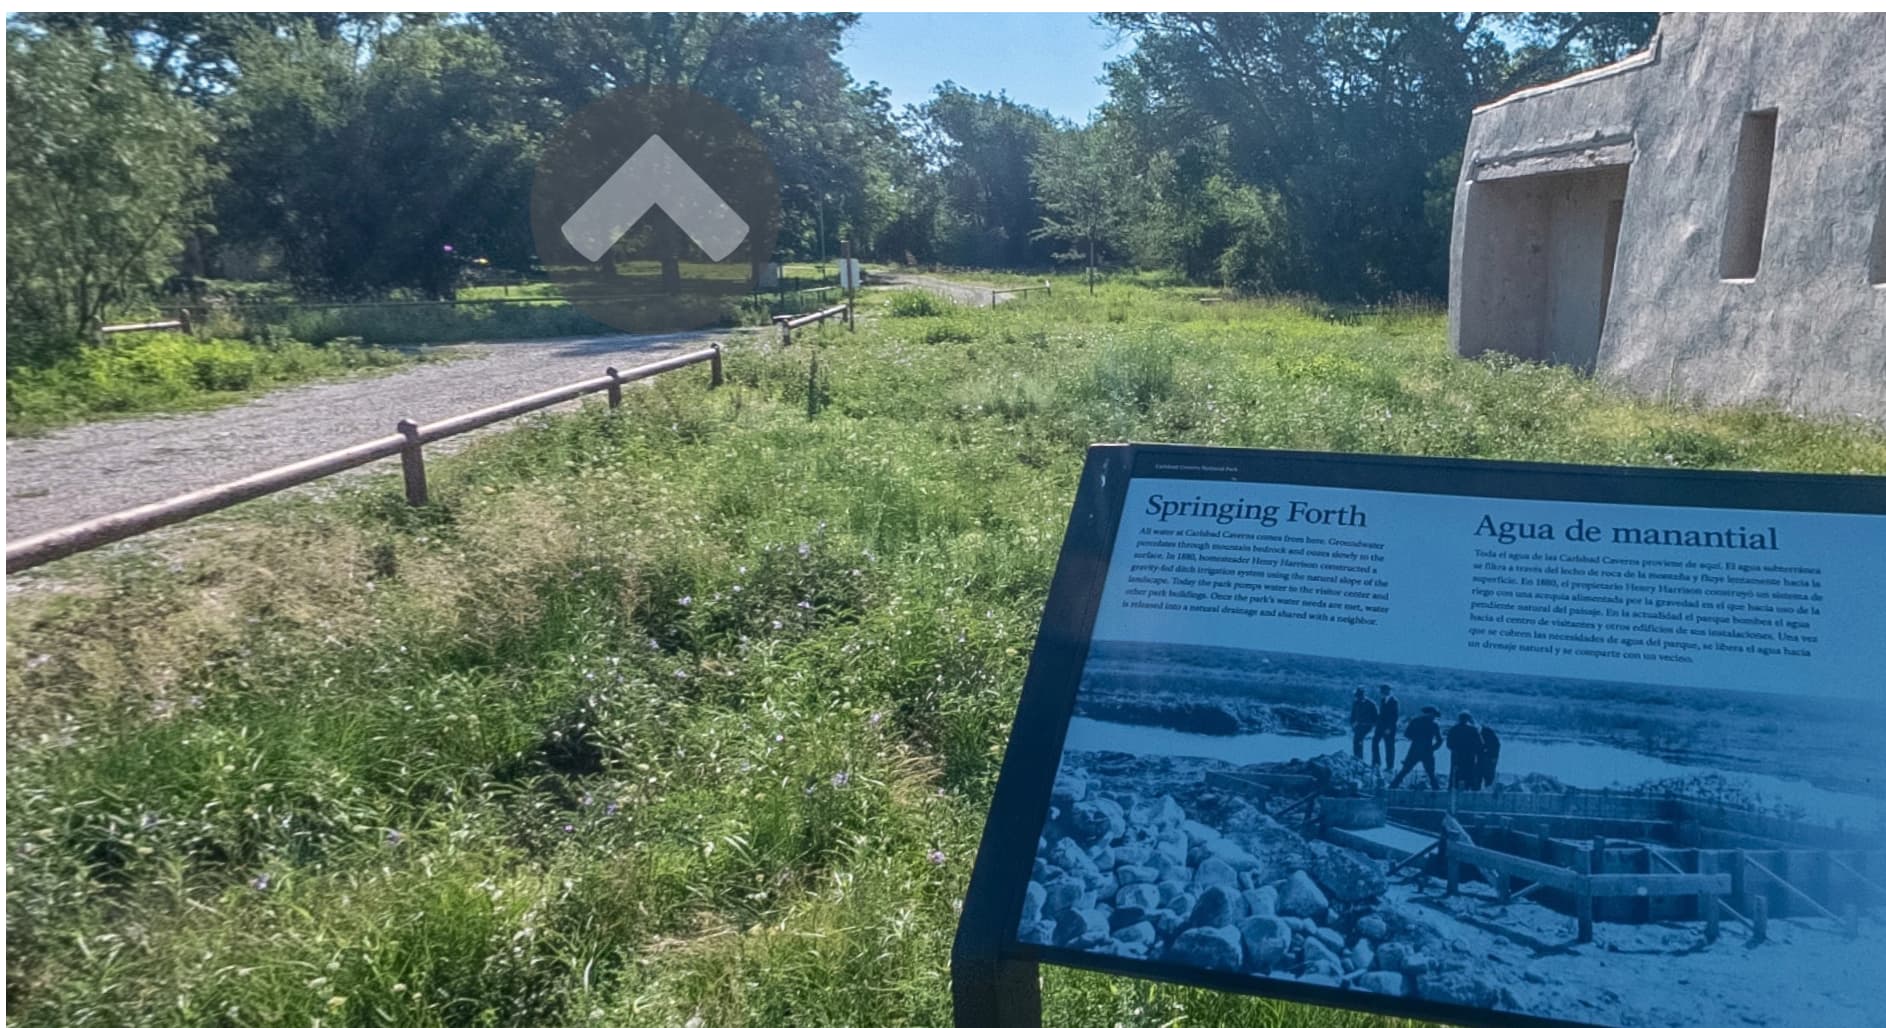
Images
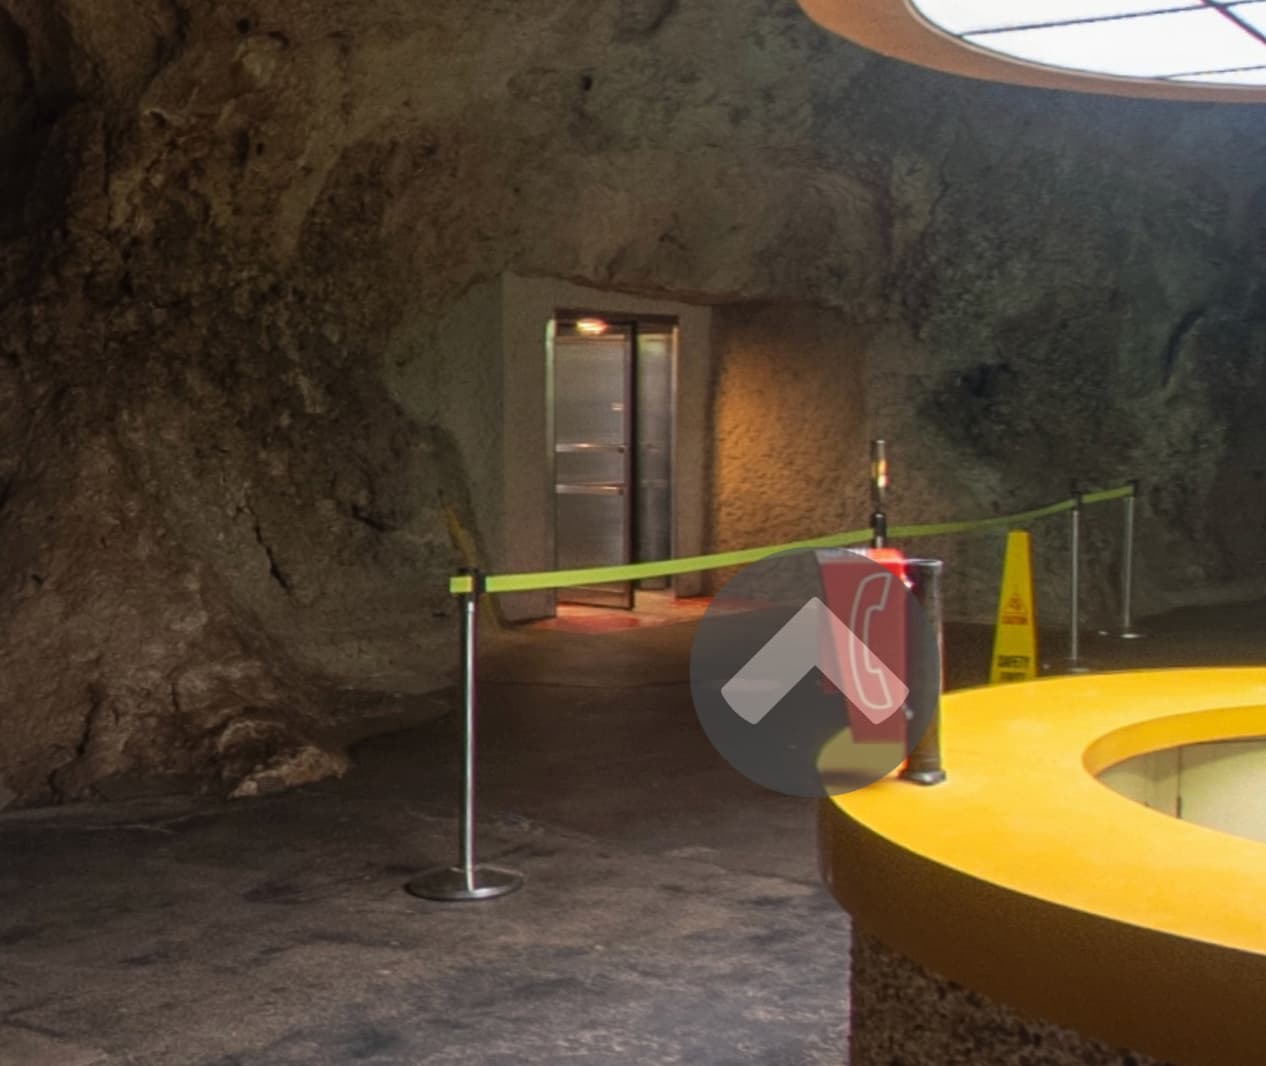
Images are from a RICOH THETA Z1 taken by the National Park
Service and released under the Public Domain, No Copyright.
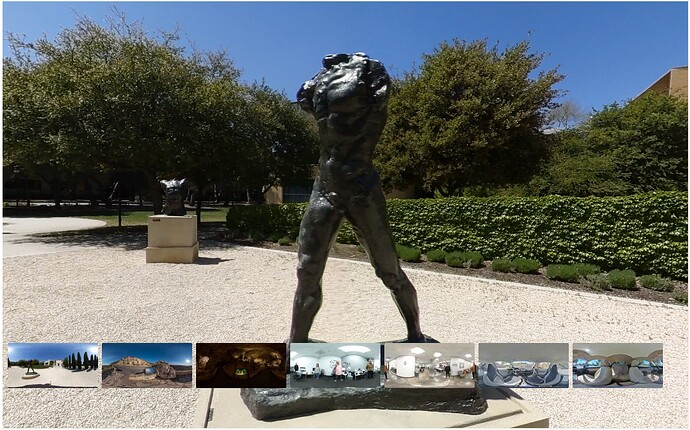
Other Tools
Running Marzipano Tool Locally
Marzipano Tool is built on top of Marzipano.
Run a web server locally such as python -m http.server
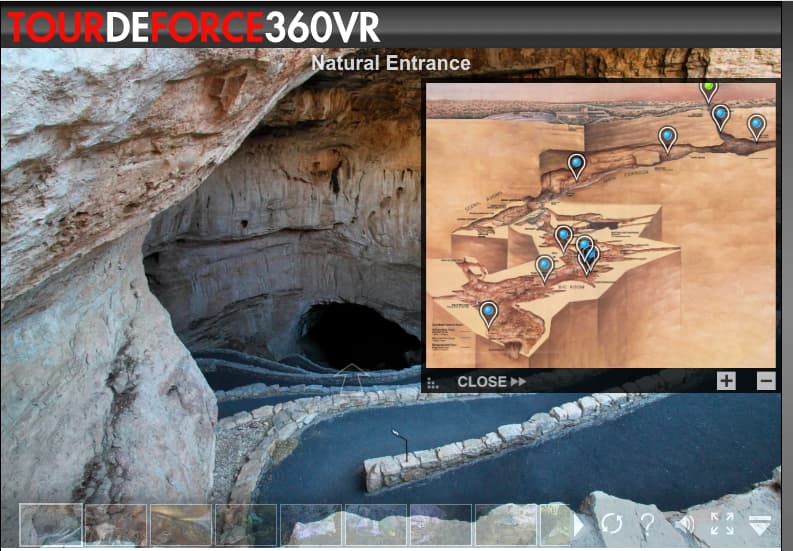
Inspiration
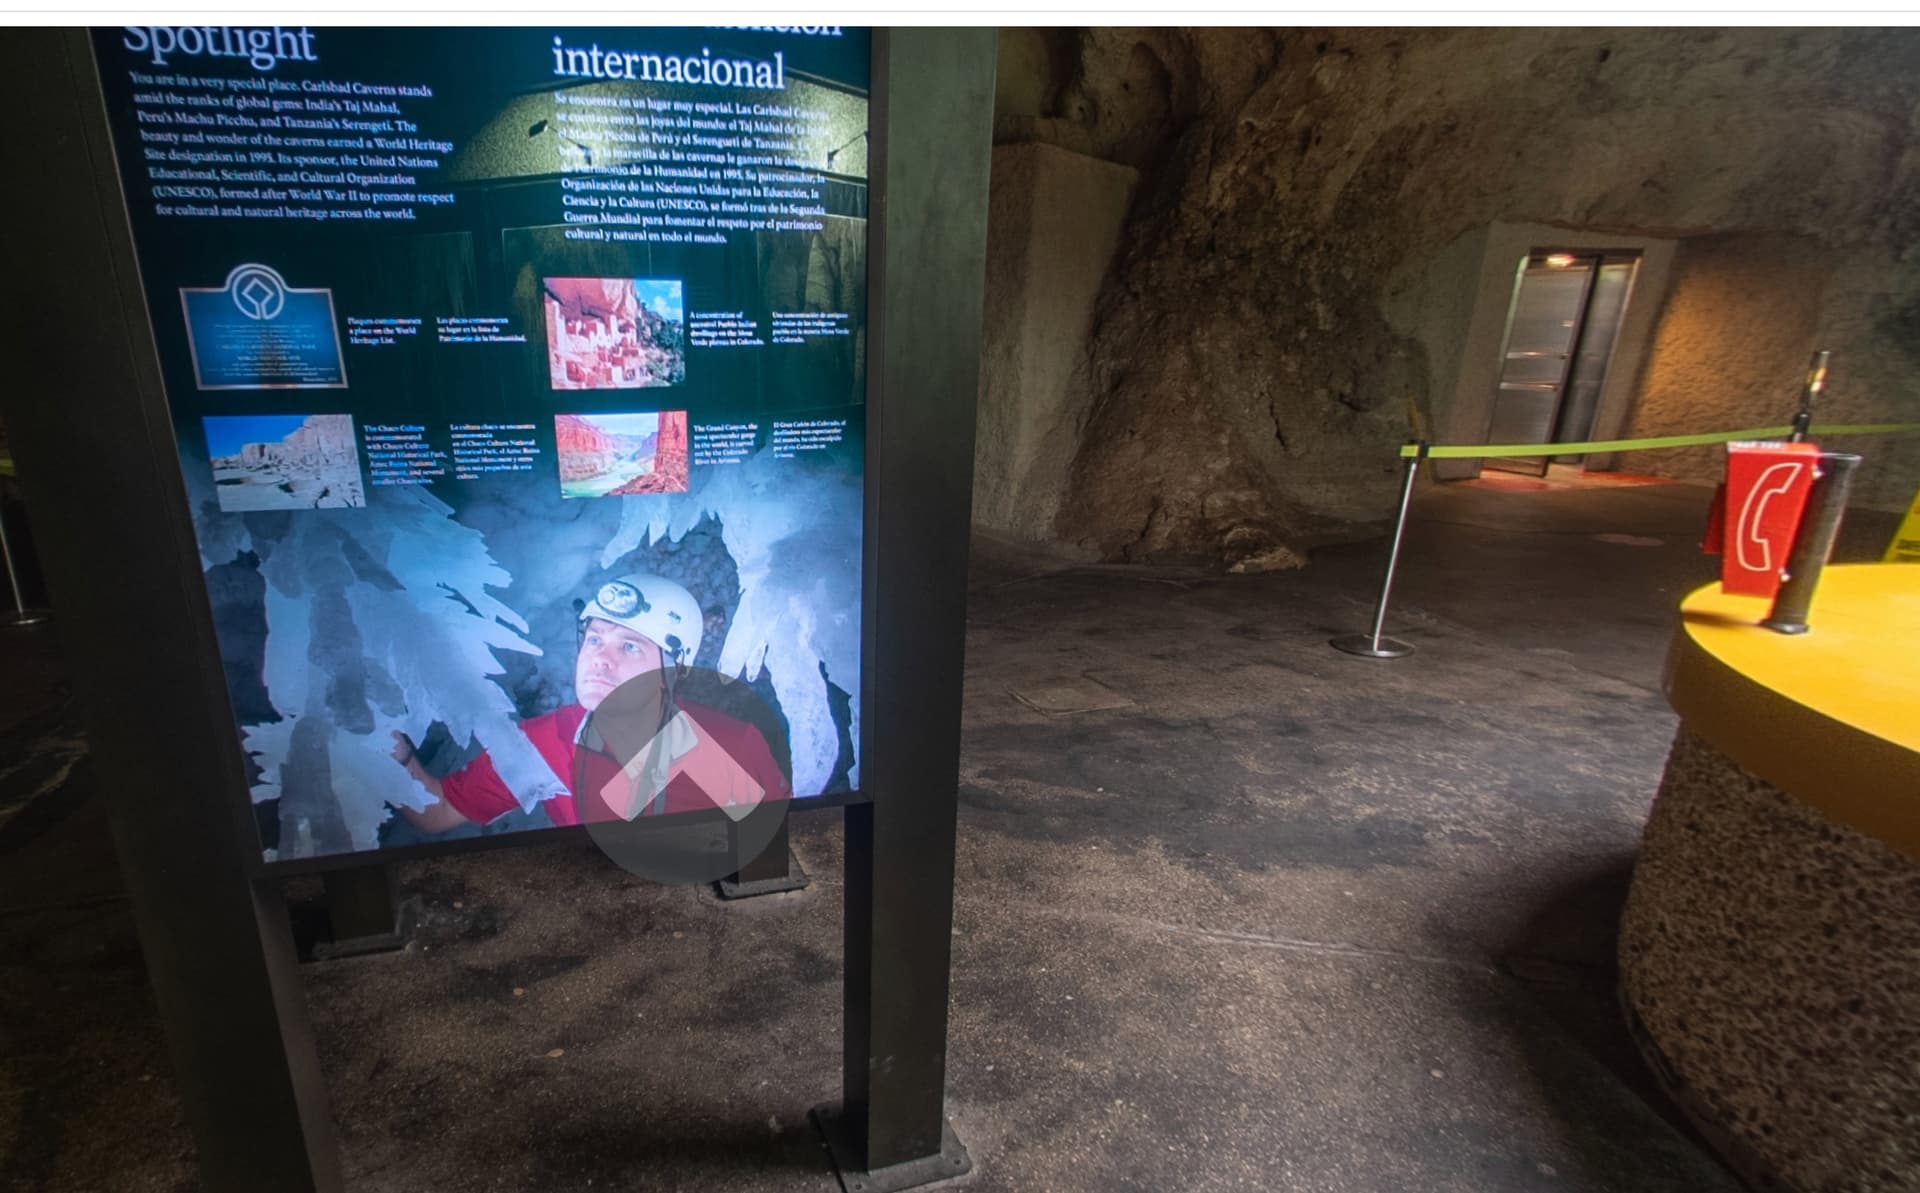
For creative ideas, check out the Tour de Force virtual tour of Carlsbad Caverns.
Future Directions
Navigation
The initial view is inconsistent depending on which arrow is pressed. Make the initial view consistent.
Performance Optimization
-
replace equirectangular with cubemap and explain difference
-
multiresolution loading
-
optimize image loading
Editing Features
-
move from mouse long-press to editor mode button
-
use Marzipano Tool again for ideas
-
build a subset as open source
-
write data to downloadable file
-
based on this discussion, it’s possible to run Marzipano locally
Data Standardization
- revise data format with Marzipano Tool as a reference.
Automating View Placement
RICOH THETA metadata has these fields:
-
PoseHeadingDegrees = 236.5
-
PosePitchDegrees = 0.0
-
PoseRollDegrees = 0.0
Pitch and roll are disabled due to auto-leveling.
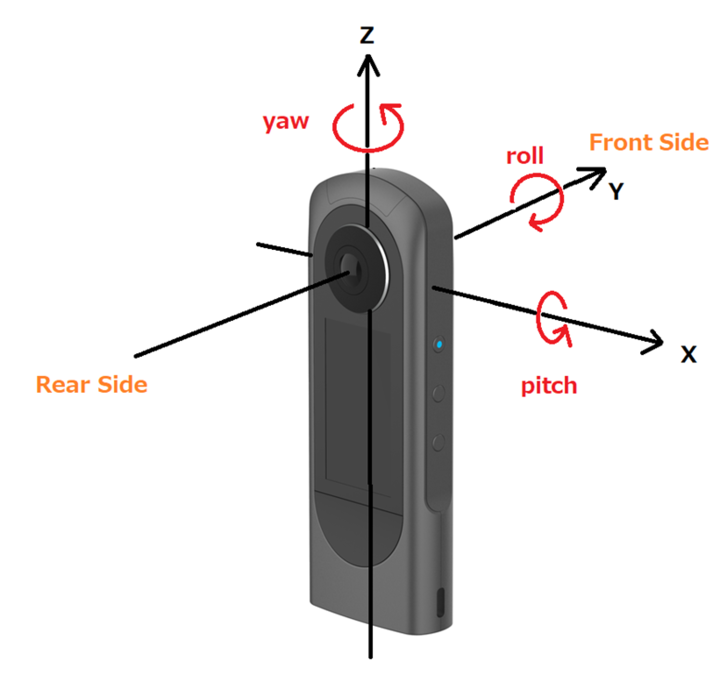
When the THETA X GPS unit is enabled, these fields are also available.
Metadata information is available on GitHub.
Video CaMM data extraction.
exiftool -ee -V3 path/to/your/video.MP4 > path/to/results.txt
CaMM data community discussions
- IMU Data Libraries
- RICOH THETA Z1 Firmware 3.01.1 - Adds Single-Fisheye, simultaneous recording of 2 videos, 50min video length
Extending the Tour
Extending the tour will help with understanding virtual tour development concepts.
add in new images
In data/data.js, go to the end of the file.
Select last element of array. Copy and paste it at the end of the array to create a new element.
PLAN: write simple editor to make this easier.
Change file name and hotspots.
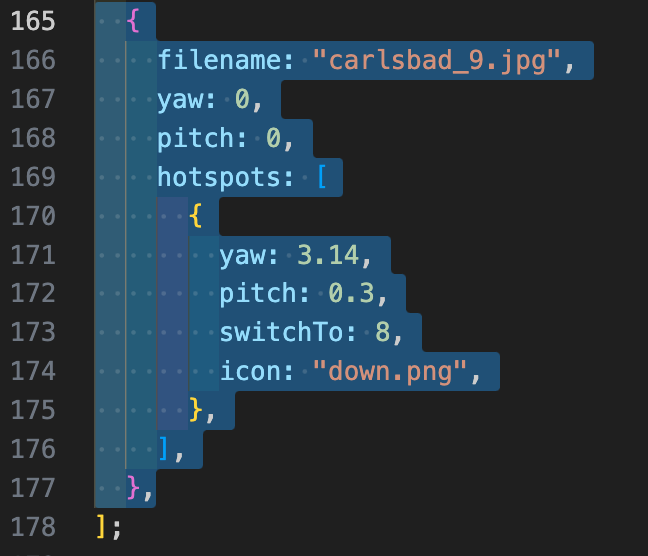
In the previous image, create a new hotspot to link to the new image. The last to entries of the data file look like this:
  {
    filename: "carlsbad_9.jpg",
    yaw: 0,
    pitch: 0,
    hotspots: [
      {
        yaw: 0,
        pitch: 0.3,
        switchTo: 10,
        icon: "up.png",
      },
      {
        yaw: 3.14,
        pitch: 0.3,
        switchTo: 8,
        icon: "down.png",
      },
    ],
  },

  {
    filename: "carlsbad_10.jpg",
    yaw: 0,
    pitch: 0,
    hotspots: [
      {
        yaw: 3.14,
        pitch: 0.3,
        switchTo: 9,
        icon: "down.png",
      },
    ],
  },
];
Adjust Location of Hotspot
Initially, the hotspot is over the sign, difficult to read, and not in a location to lead to another image.
Press and hold a spot for 5 seconds.
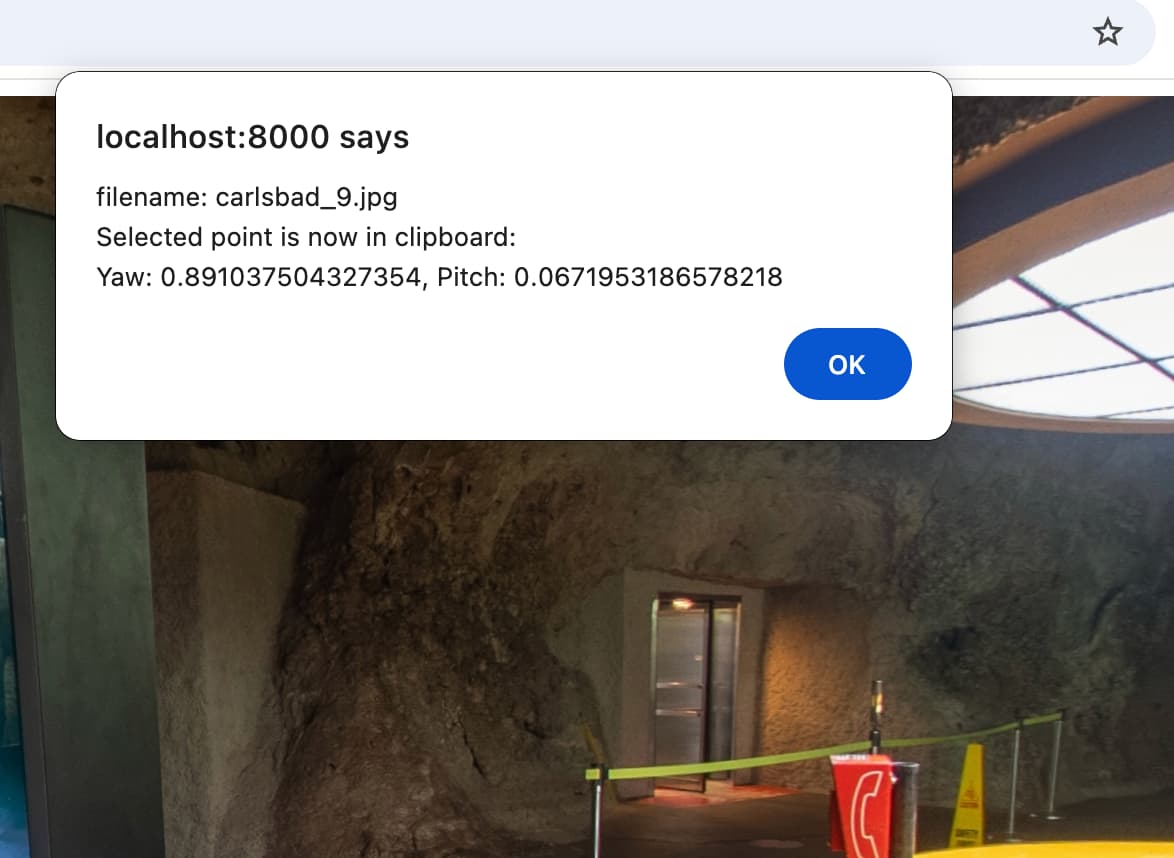
In the hotspot section of the image, delete the existing pitch and yaw. The new pitch and yaw is stored in the clipboard.

Paste the contents of the clipboard into the data file.
Add a comma if necessary.
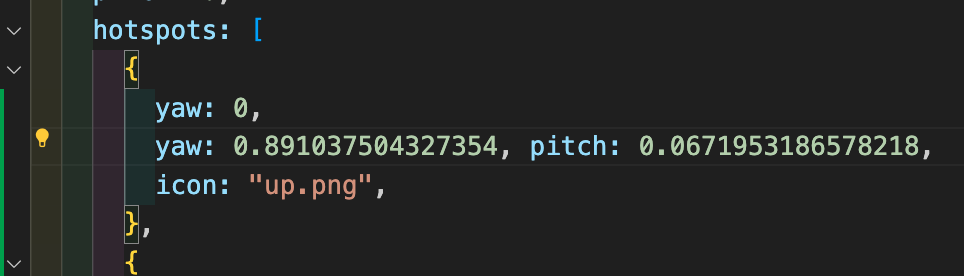
Reload tour to test.
Celebrate and Plan Next Steps
Congratulations on adding a new image.
Hopefully, this motivates you to write a simple editor to save the data in JSON and modify the tour code to read in the JSON from a file. Check out Marzipano tool for ideas.
Have fun!